注意
跳转到末尾以下载完整的示例代码。
绘制管道#
除了使用onnx查看其节点,没有其他方法可以深入了解以ONNX格式存储的模型。本示例演示了如何绘制模型并以json格式检索它。
以JSON格式检索模型#
这是最简单的方法。
/home/cloudtest/.local/lib/python3.10/site-packages/onnxruntime/capi/onnxruntime_validation.py:113: UserWarning: WARNING: failed to get cudart_version from onnxruntime build info.
  warnings.warn("WARNING: failed to get cudart_version from onnxruntime build info.")
ir_version: 3
producer_name: "chenta"
graph {
  node {
    input: "X"
    input: "W"
    output: "Y"
    name: "mul_1"
    op_type: "Mul"
  }
  name: "mul test"
  initializer {
    dims: 3
    dims: 2
    data_type: 1
    float_data: 1
    float_data: 2
    float_data: 3
    float_data: 4
    float_data: 5
    float_data: 6
    name: "W"
  }
  input {
    name: "X"
    type {
      tensor_type {
        elem_type: 1
        shape {
          dim {
            dim_value: 3
          }
          dim {
            dim_value: 2
          }
        }
      }
    }
  }
  output {
    name: "Y"
    type {
      tensor_type {
        elem_type: 1
        shape {
          dim {
            dim_value: 3
          }
          dim {
            dim_value: 2
          }
        }
      }
    }
  }
}
opset_import {
  domain: ""
  version: 7
}
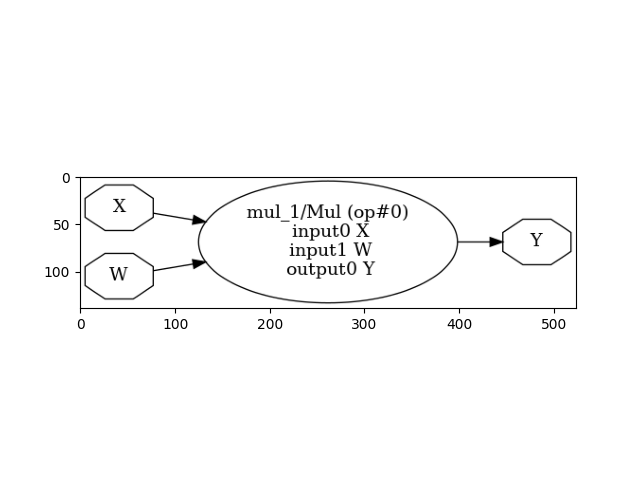
使用ONNX绘制模型#
我们使用 *onnx* 包中包含的 net_drawer.py。我们使用 *onnx* 以与之前不同的方式加载模型。
我们将其转换为图。
from onnx.tools.net_drawer import GetOpNodeProducer, GetPydotGraph  # noqa: E402

pydot_graph = GetPydotGraph(
    model.graph, name=model.graph.name, rankdir="LR", node_producer=GetOpNodeProducer("docstring")
)
pydot_graph.write_dot("graph.dot")
然后转换为图像
import os  # noqa: E402

os.system("dot -O -Tpng graph.dot")
0
然后我们将其显示出来……
<matplotlib.image.AxesImage object at 0x73026fb3bf70>
脚本总运行时间: (0分钟 2.016秒)